
Market Rate Intelligence
See the going rate for any lane, and how the rate on a load compares with the market, right where you post, price and book.
How it works
Choose the pickup city, the delivery city and the equipment.
Get the headline rate per mile and the trip average, over windows from the last 24 hours to the last four months.
On a load, see where its rate sits: well below, below, in line, above or well above the market.
Browse the best-paying routes across the country, and the top-paying lanes out of any place.
Watch
Video coming soon
We are preparing this video. Check back soon.
What you get
Pick two places and the equipment and get the market rate for that lane.
Last 24 hours, 3 days, 7 days, 30 days, 2 months and 4 months, side by side.
A plain label and a percentage, so you can see at a glance if a rate is fair.
See how the lane moved per mile over the last 30 days, not just today’s figure.
The best-paying lanes nationally, with the number of loads behind each figure.
Choose an origin and see which lanes out of it pay best, with the low and high range.
On the post-a-load form, on a load, on the board and on a truck posting.
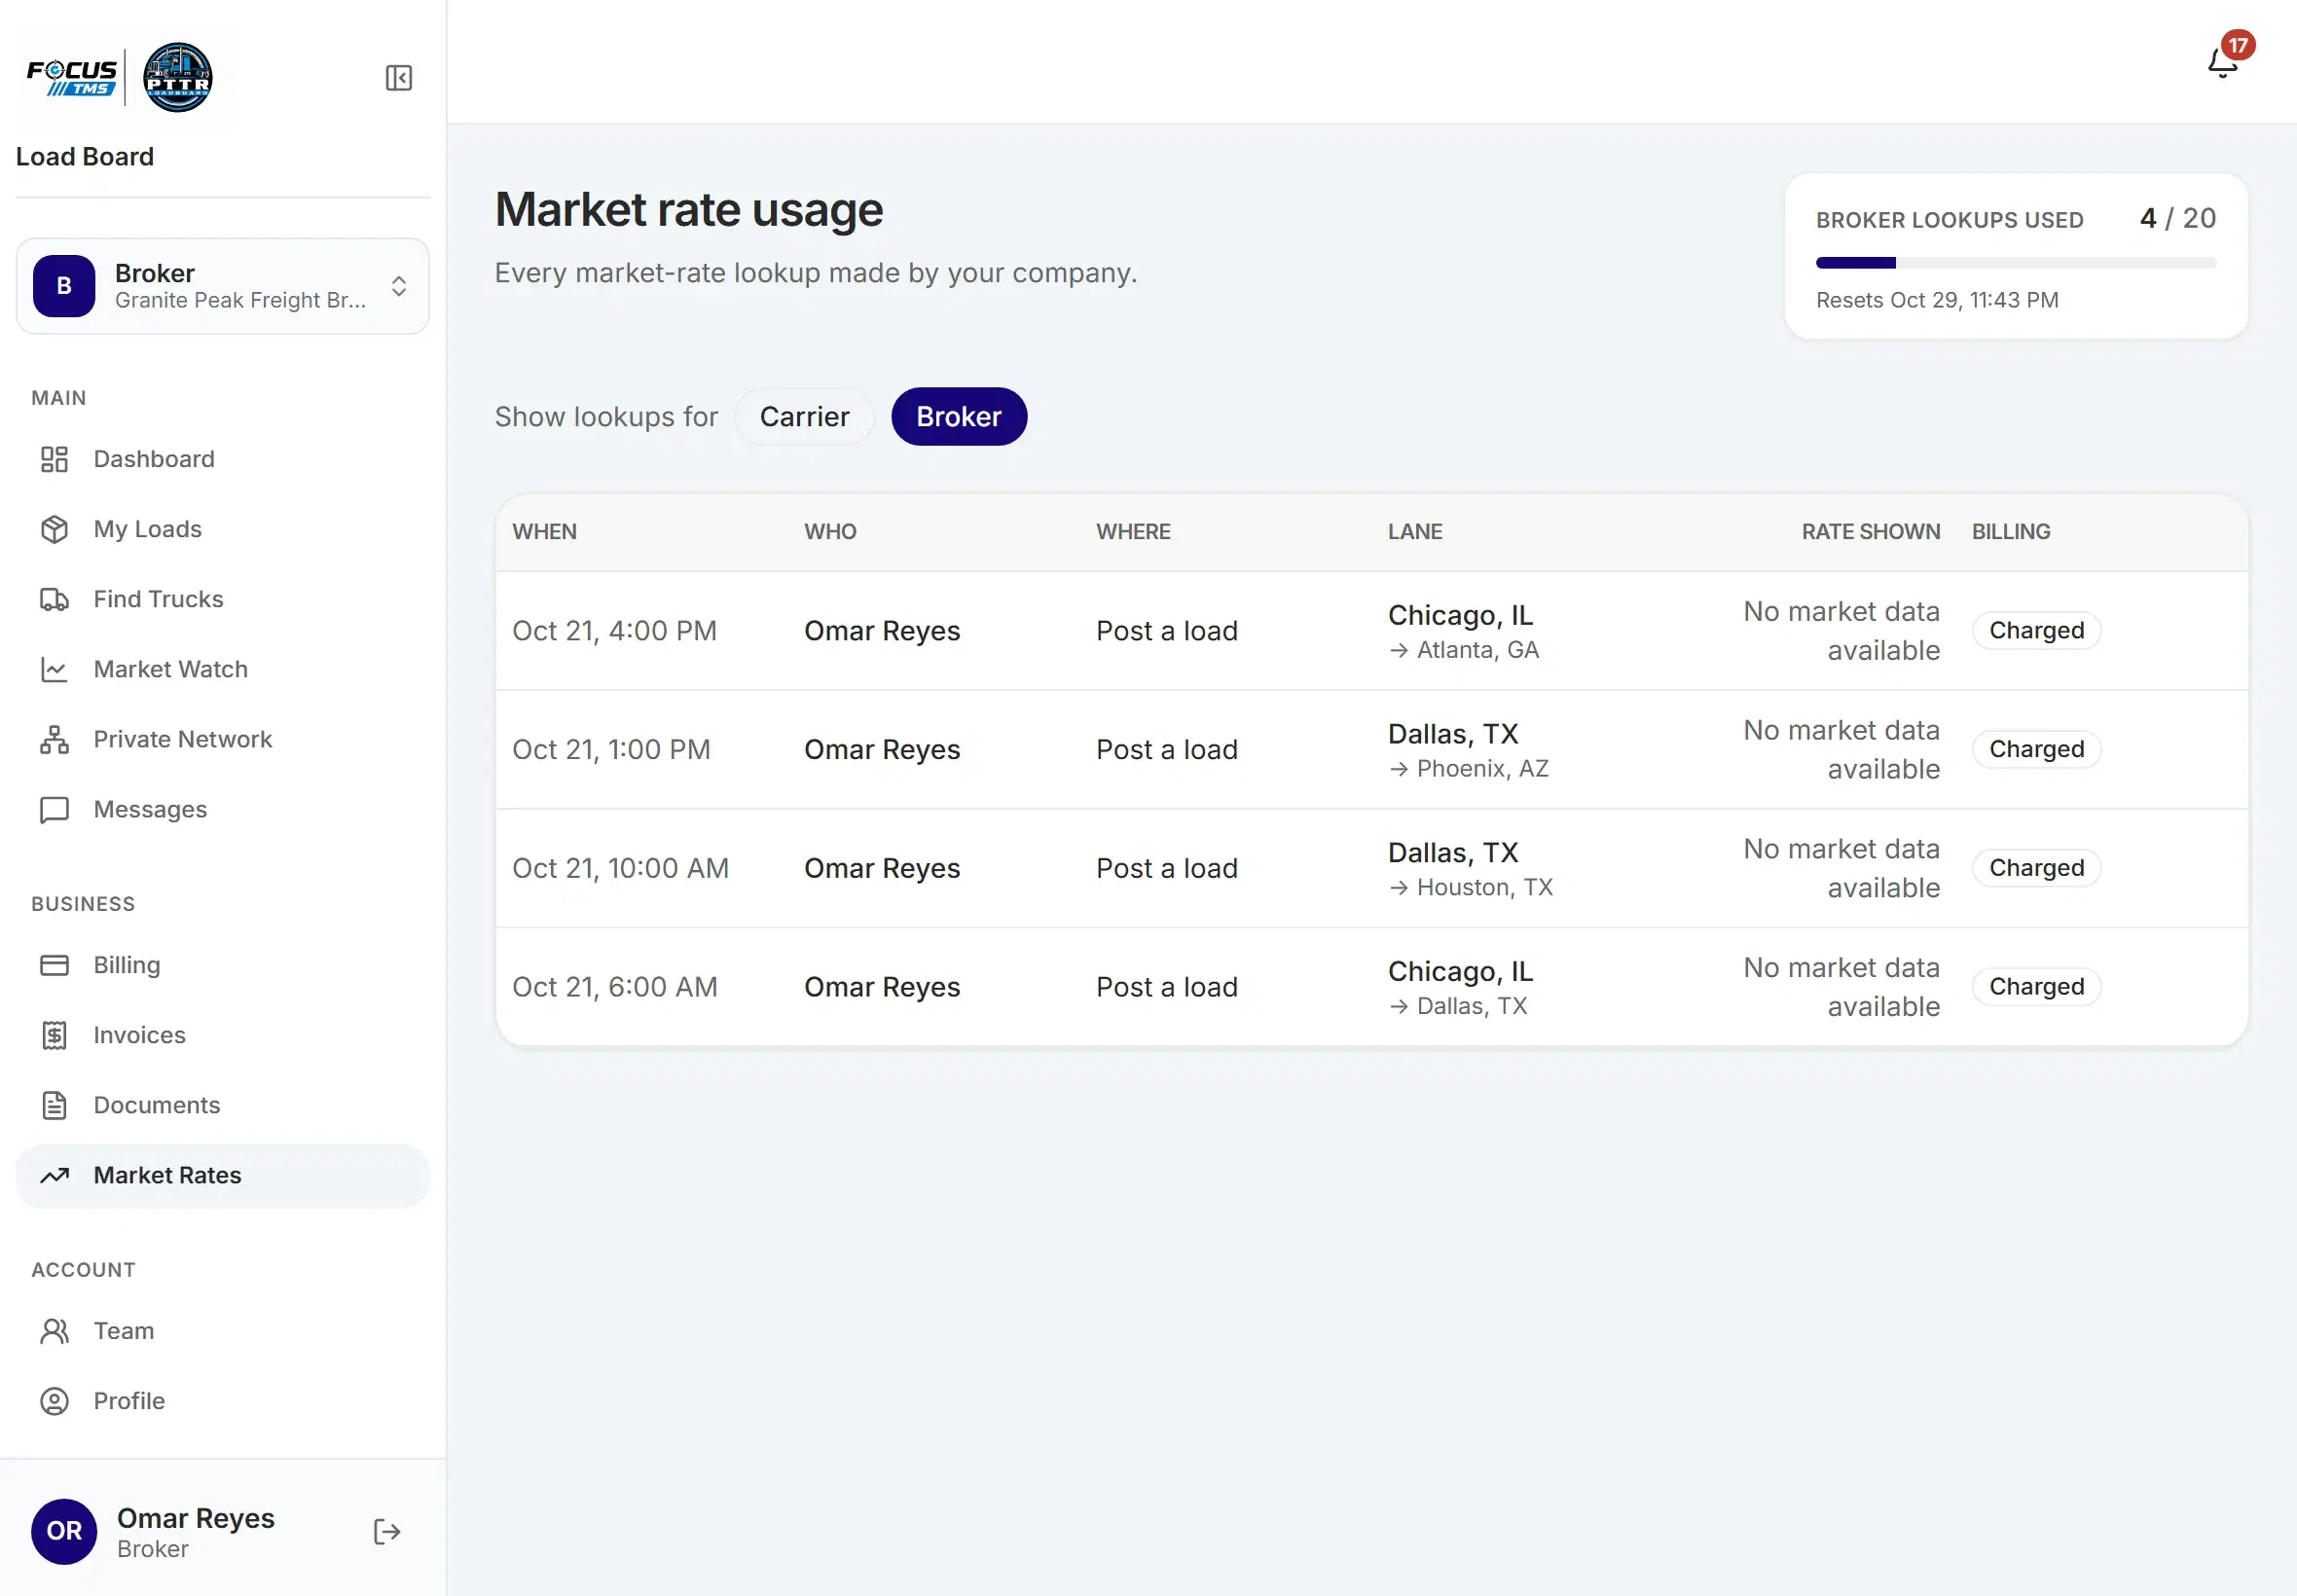
See who looked up what, where and when, so lookups are easy to follow.
Reading it
| Figure | What it tells you |
|---|---|
| Headline rate | The main per-mile figure for the lane. |
| Trip average | The average total paid for a trip on the lane. |
| Window | The period a figure covers, from the last 24 hours to the last 4 months. |
| Against market | How a rate compares with the market: well below, below, in line, above or well above. |
| Range | The low and high per-mile figures over the last 30 days. |
| Loads | How many loads the figure is based on. |
Who uses it
What it means for you
Good to know
More from Intelligence
Create an account and start with the lanes you run.